01Project overview
My role: design and build the connected experience.
- Role
- Product designer & developer
- Scope
- Research framing, UX, UI, content, front-end
- Status
- Working independent product
- Audience
- Soccer supporters learning to interpret data
- Platform
- Responsive web application
Core design decisions
- Analyze: A customizable dashboard of focused modules for exploring soccer performance.
- Learn: Visual lessons and explanatory feedback that help supporters interpret sports statistics.
- Cross-section connections: A feedback loop between analysis and learning that preserves the question and its context.
Research and opportunity
Help supporters turn soccer statistics into an understanding of performance.
A win, a possession percentage, or an xG total raises different questions about how a team played. I designed Lensala for supporters who know the sport but need help choosing and interpreting the evidence.
InsightChaser reviewed 204 soccer visualization-and-text examples and interviewed six fans. Missing tactical context, unexplained terms, and skipped reasoning made analysis harder to follow.
A recruitment-dashboard study with five basketball coaches found unclear metrics, hidden filters, and difficult resets. These external studies informed my design hypotheses.
Design response Connect statistics to match events, chance quality, and comparisons. Keep context and methodology visible, then link the evidence to lessons that explain the reasoning and return supporters to their analysis.
One question.
Two ways to understand it.
Shared context.
02Making data usable
A useful starting view, sixteen focused modules, and shared selections that keep the evidence consistent.
Dashboard walkthrough · 0:30
Context bar
Keep selections consistent, with room for exceptions
I placed shared context in the header so visitors have a visible reference as they move between modules. League and club crests, player identity, and the match score make the current selections recognizable without repeating setup in every card.
- League · Define the scope
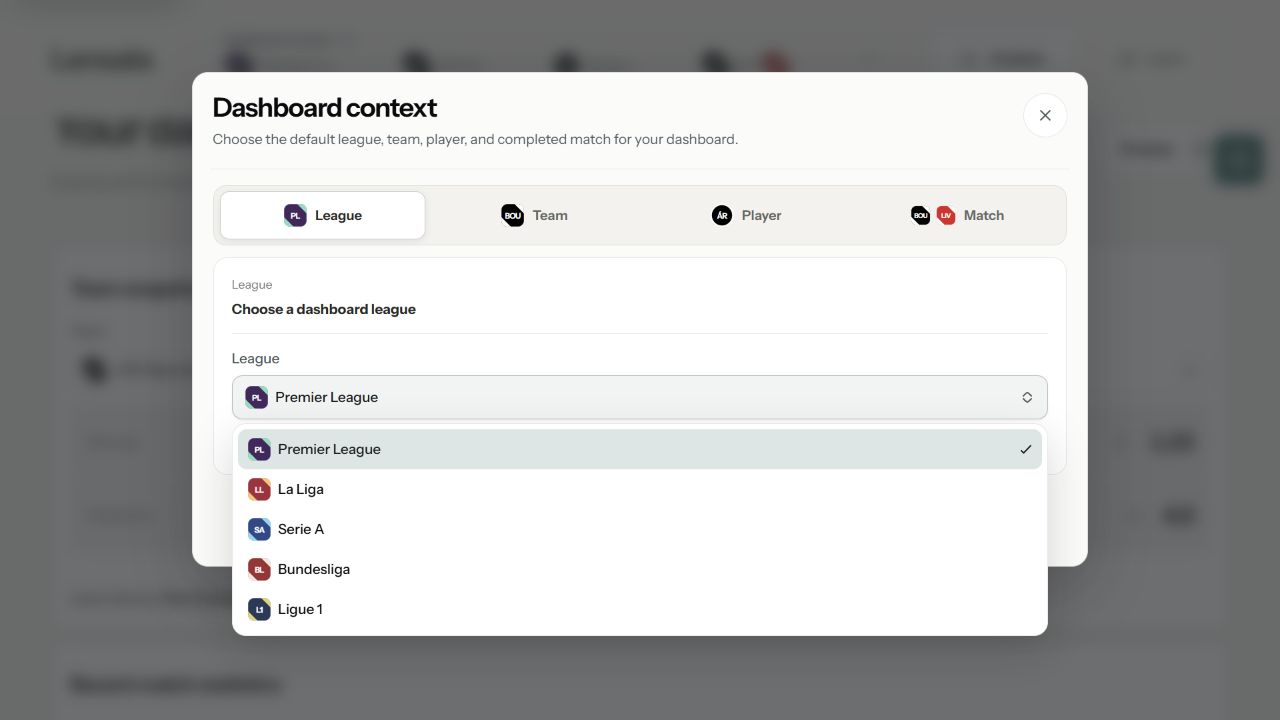
Set the competition and narrow the team choices, keeping the dashboard’s scope clear.
- Team · Recognize, then choose
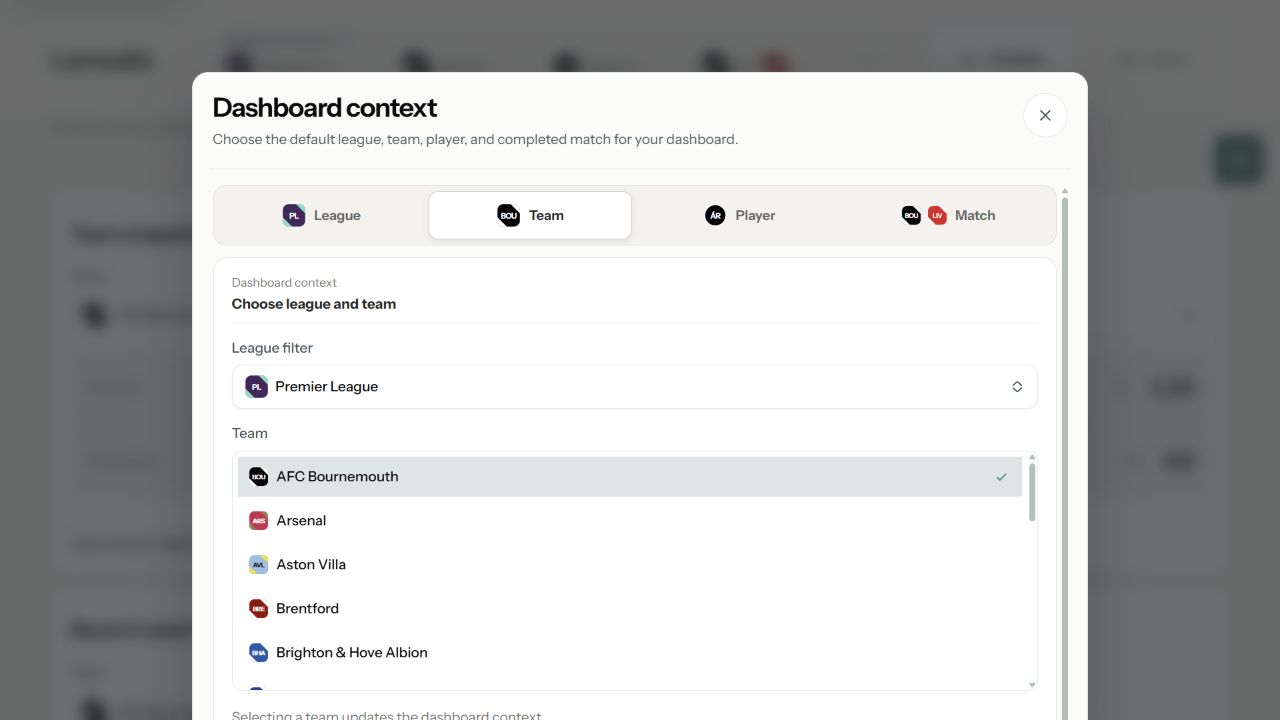
Filter clubs by league; names and crests make the right team easy to recognize.
- Player · Browse or search
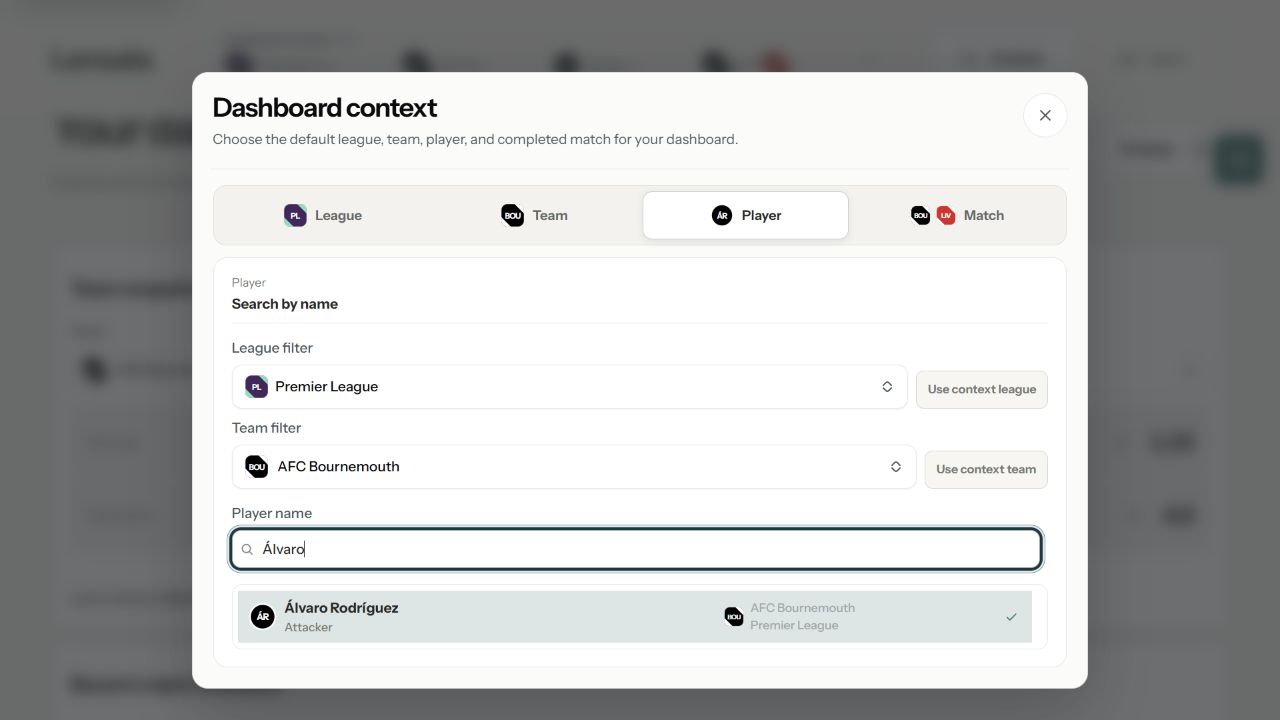
Browse a squad or search by name, using club and position details to distinguish players.
- Match · Anchor the evidence
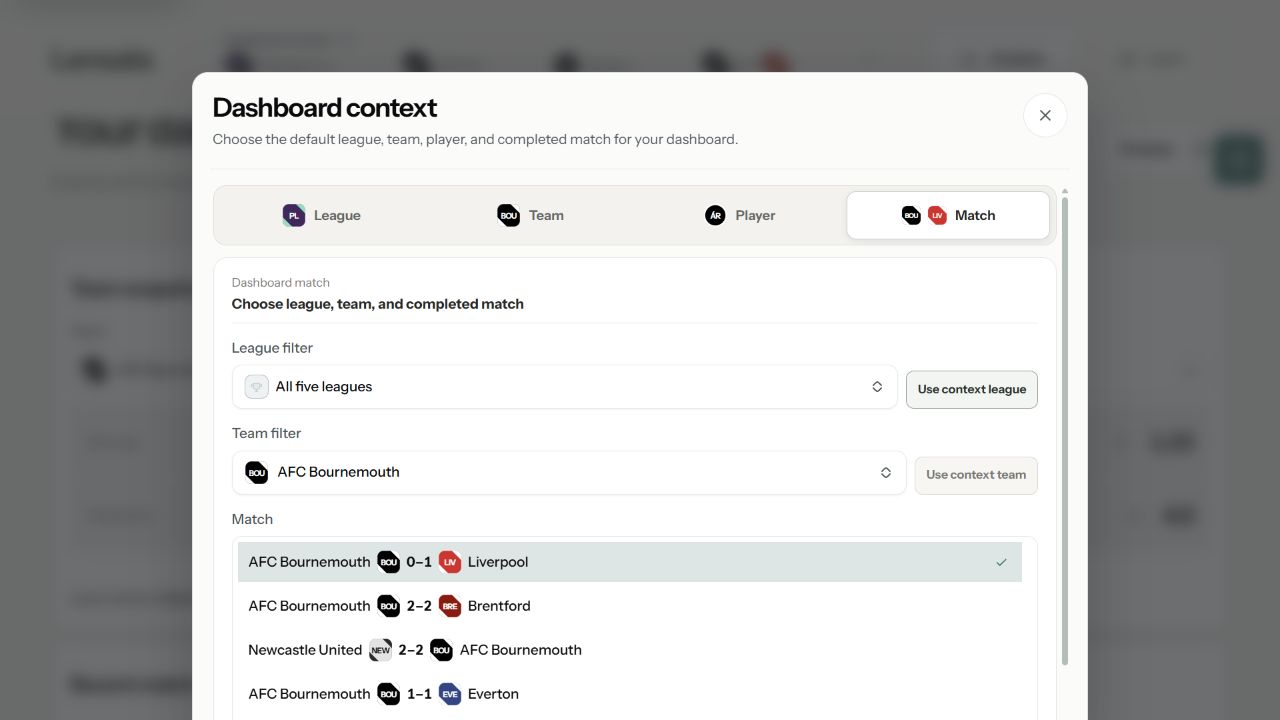
League and team filters narrow completed matches; club names and scores identify the game being analyzed.
Brief pop-ups confirm changes to the league, team, player, or match and show the new selection. They make updates visible without interrupting analysis.
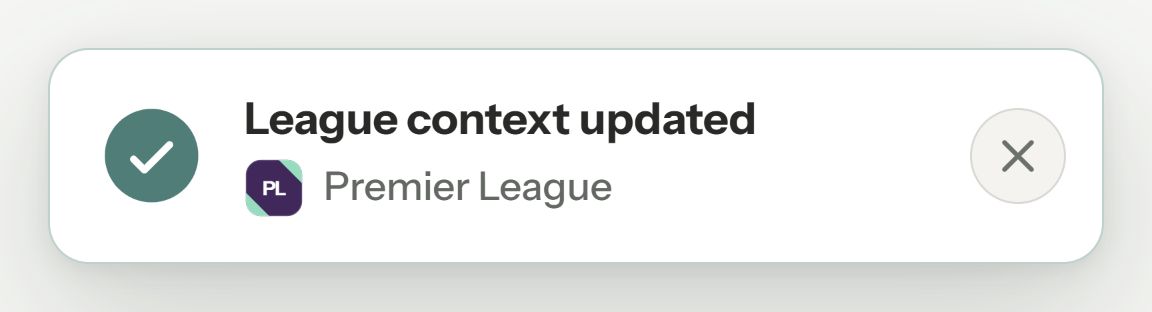
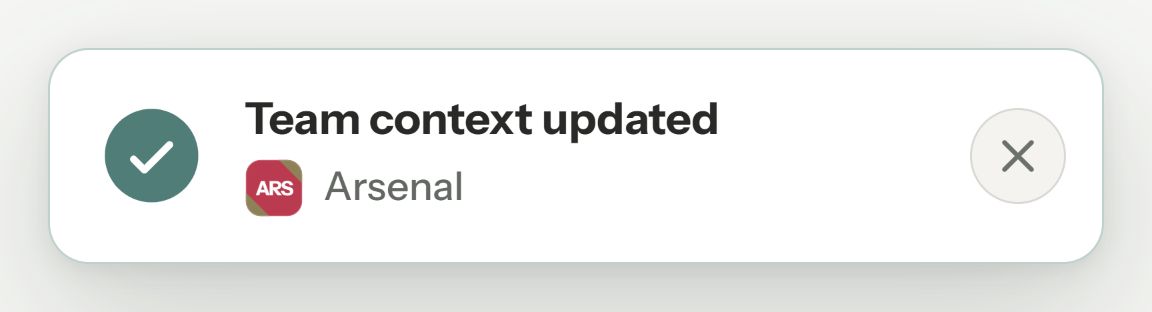
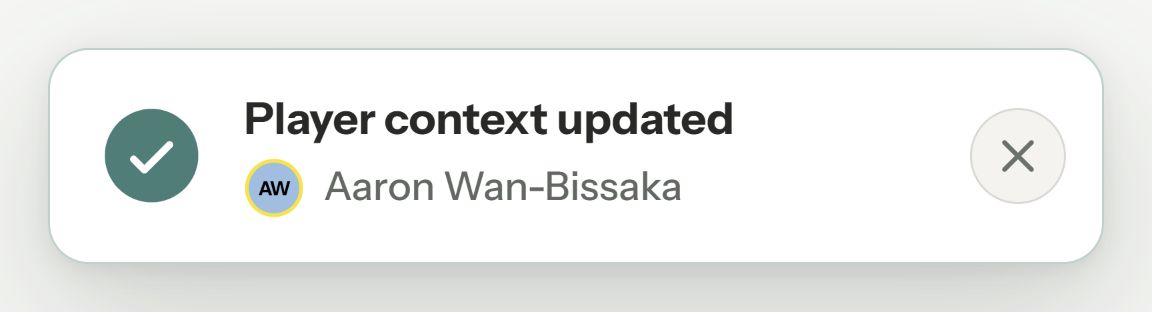
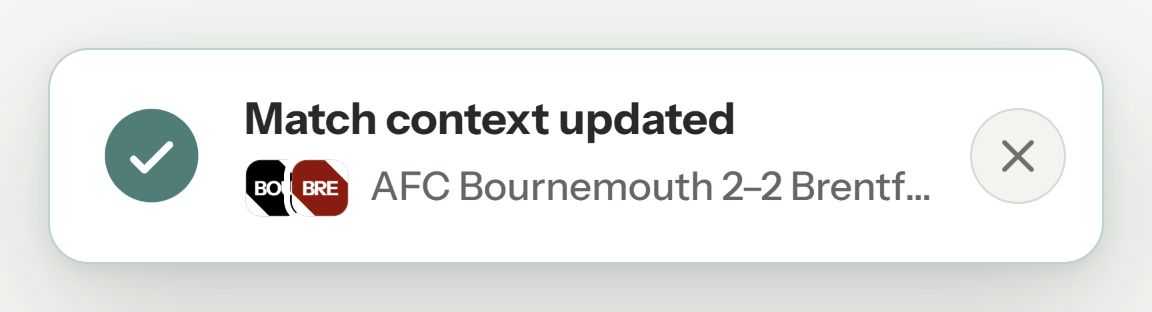
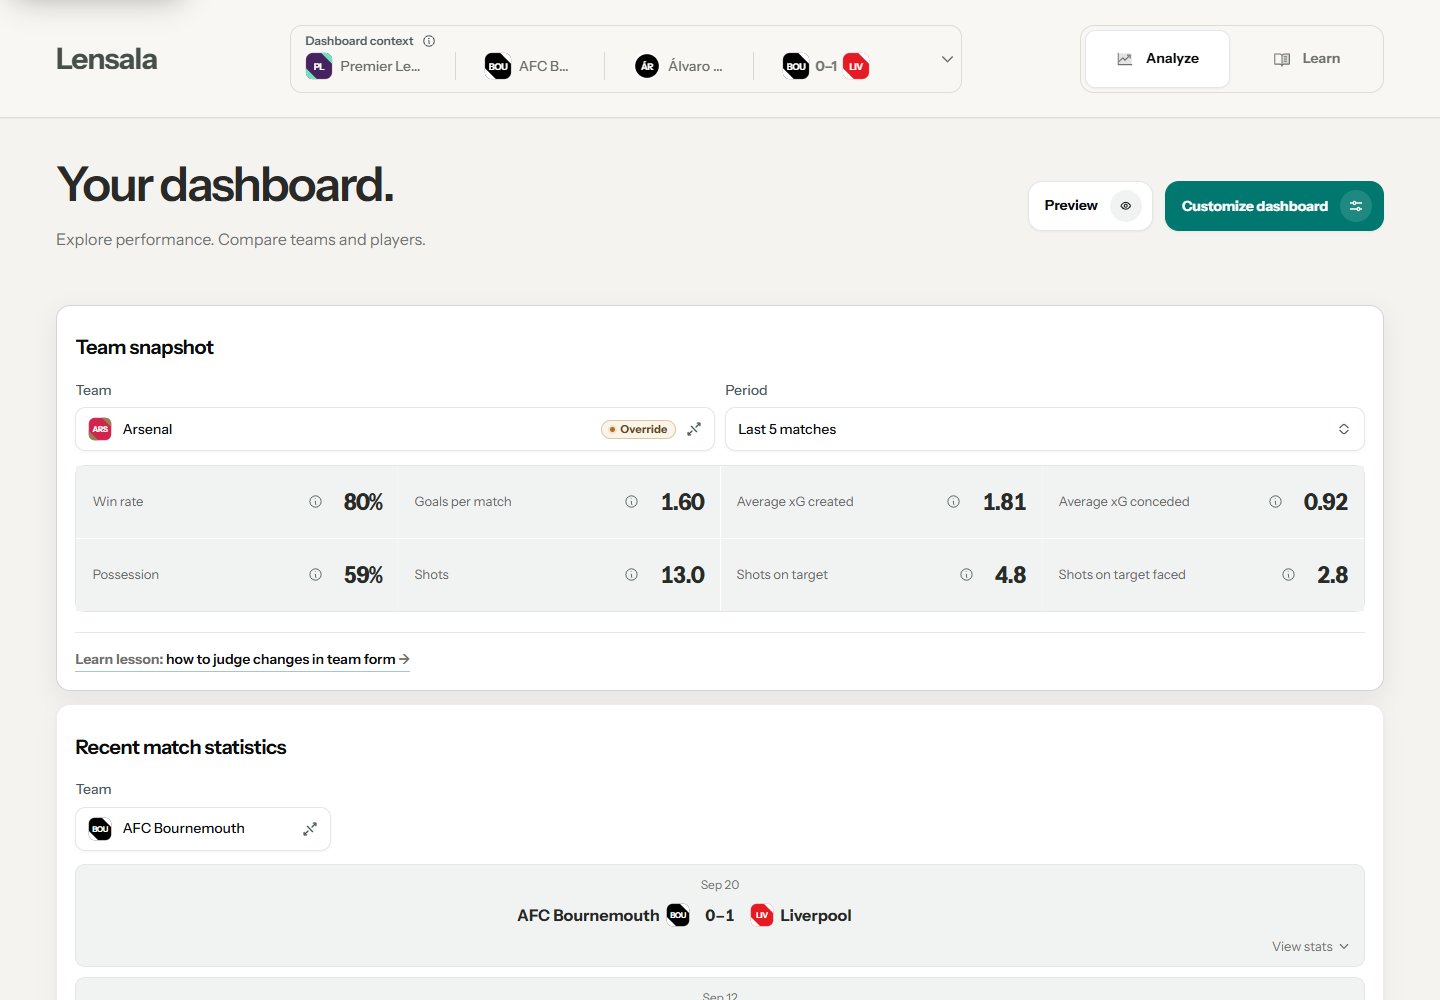
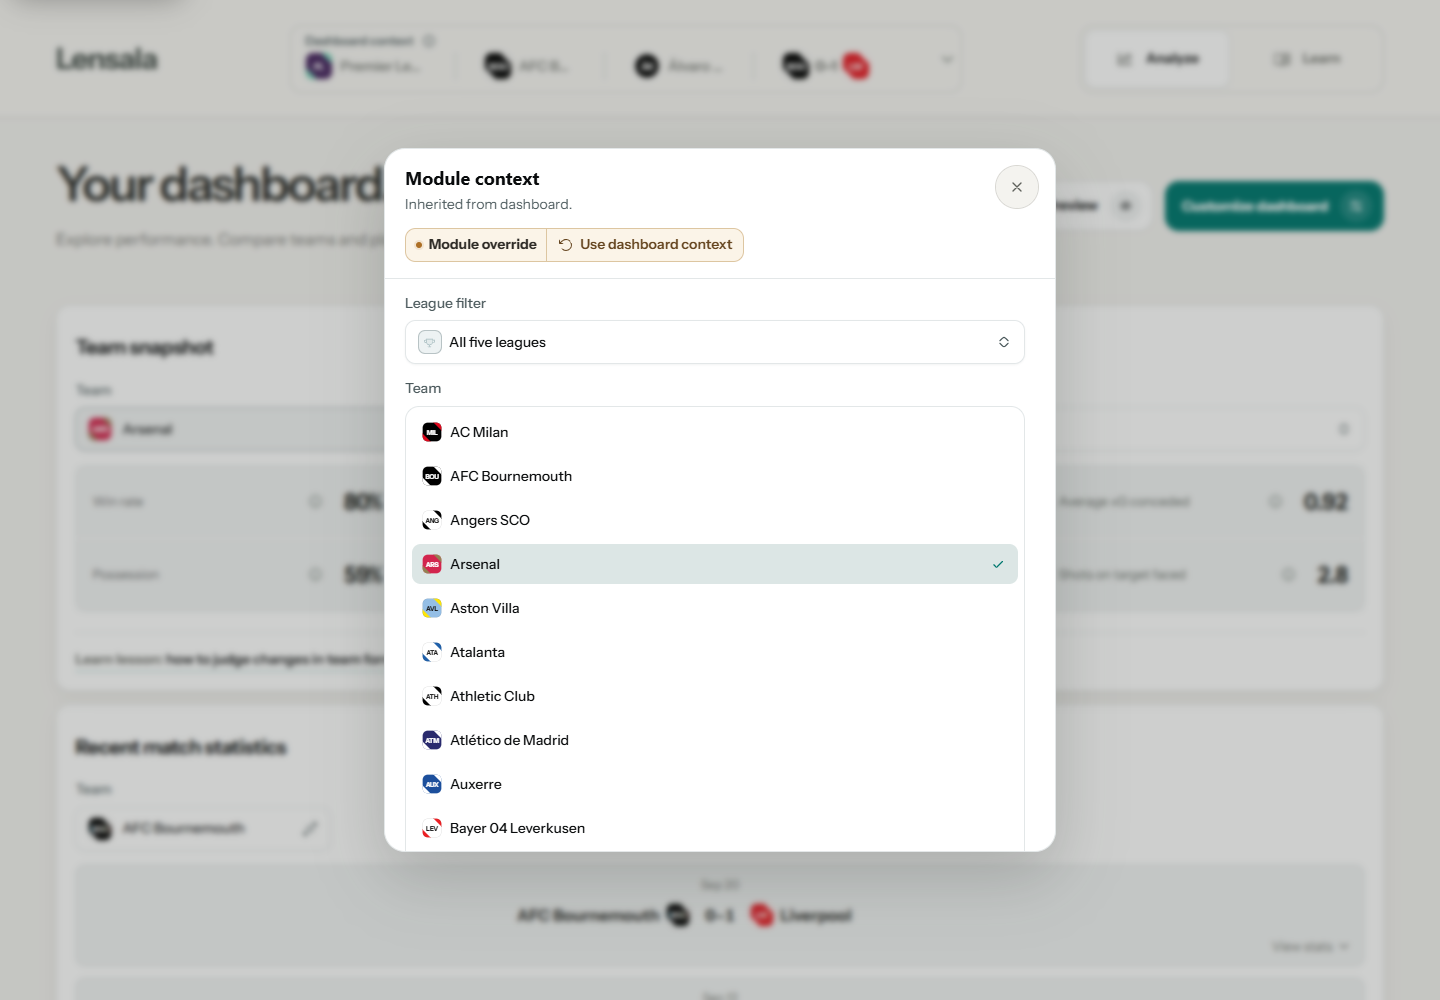
Module selectors expose only the context relevant to that card. A card can override the shared selection for comparison: its visible Override badge identifies the exception, and Use dashboard context reconnects it. Explicit labels, selected states, and keyboard navigation make the choices usable beyond visual recognition alone.
Override the shared selection
Reset to dashboard context
- Considered
- Repeating selectors inside every module
- Chose
- One shared context with explicit local overrides
- Tradeoff
- Overrides require a visible exception state so people know which cards no longer match
Individual modules
One module, one clear job
Sixteen modules are grouped by Match, Team, Player, and League. Each starts with a soccer question and a visual preview, making its purpose visible before someone adds it.
Context-based recommendations and suggested pairings help visitors choose complementary evidence. A module already on the dashboard shows an Added state.
- Considered
- One fixed dashboard and long descriptions for every chart
- Chose
- Focused modules introduced by the question each one answers
- Tradeoff
- More flexibility creates more choice, so recommendations, pairings, search, and presets provide direction
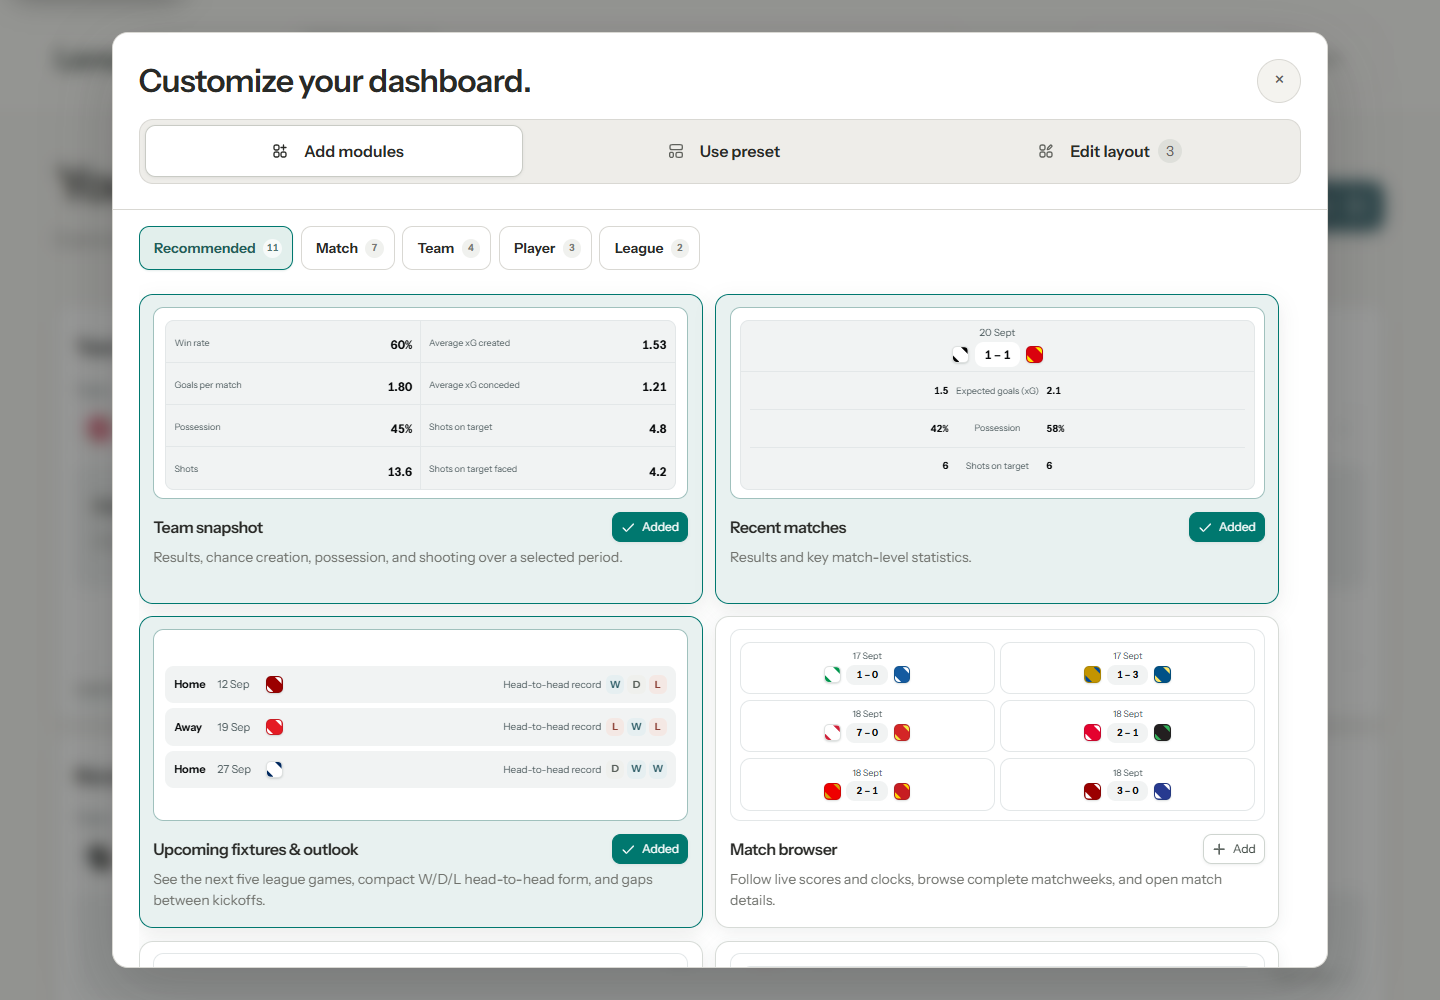
Module decision library
The rationale for each module
Match module
Match browser
What is happening across the matchweek?
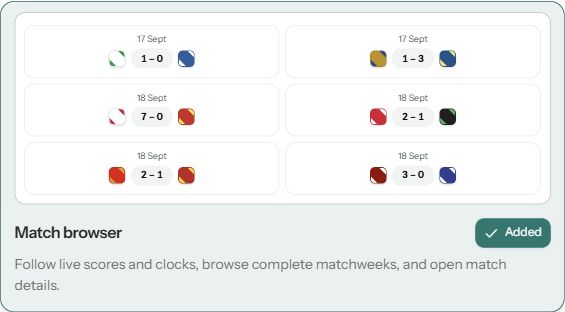
- Design decision
- Combine live scores, matchweek browsing, and match detail in one entry point.
- Why it matters
- People can move from league-wide awareness to a specific match without changing tools.
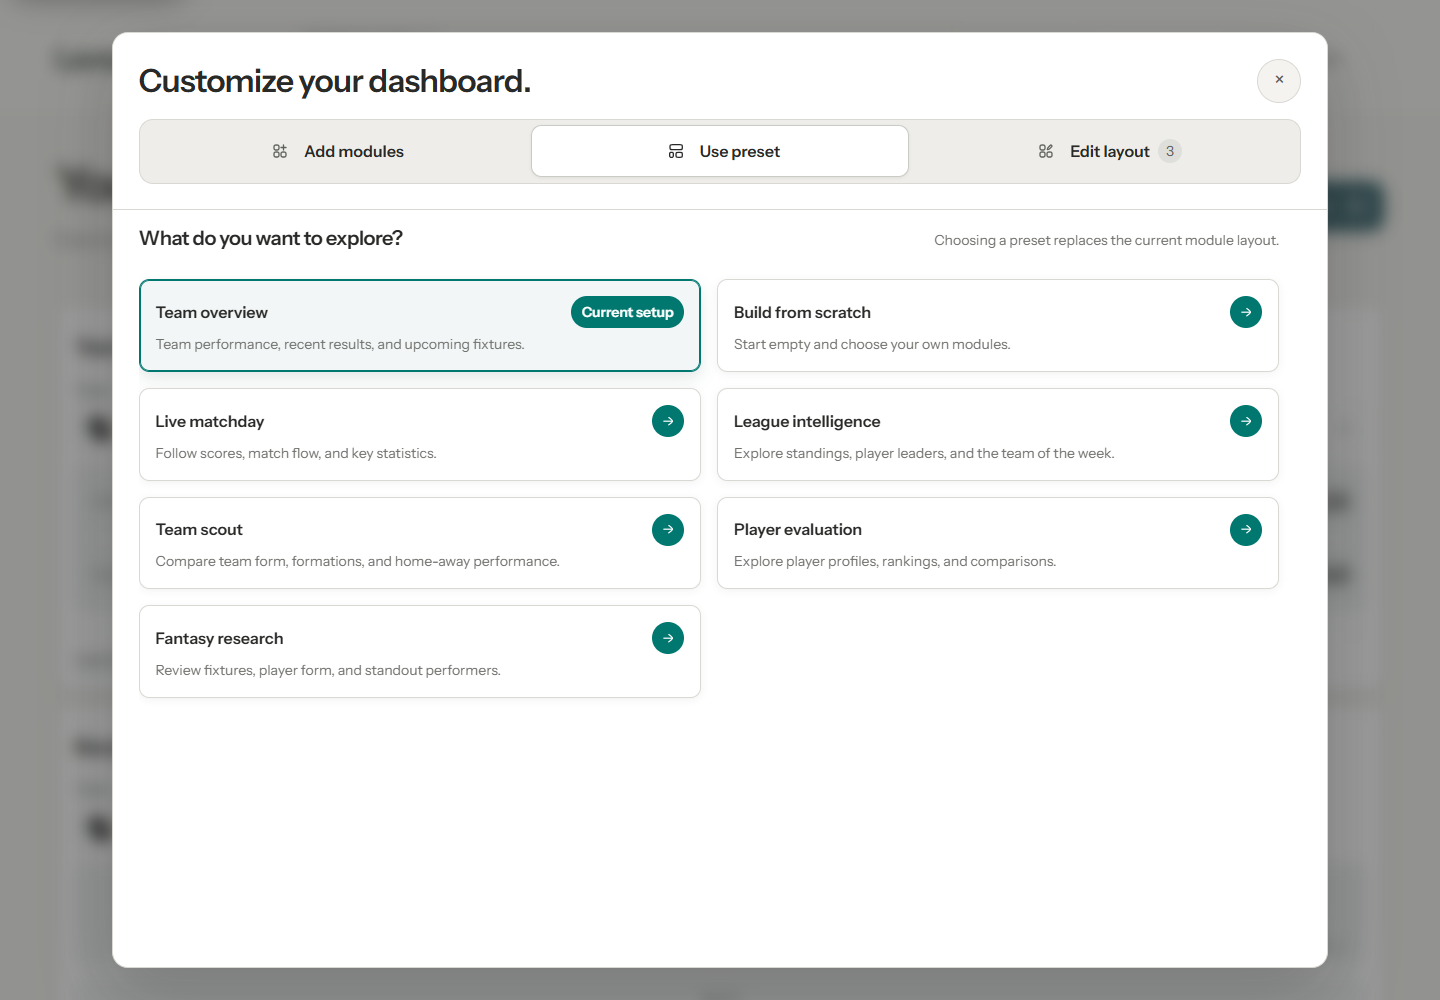
Customize dashboard · Presets
Start with a task, not an empty canvas
Seven presets turn goals such as team analysis, scouting, and player evaluation into a ready-to-use reading order. Every module remains editable.
Choosing a preset replaces the current layout. The notice appears before selection so the faster setup does not hide its consequence.
- Considered
- An empty canvas or silently merging every preset into the current view
- Chose
- A useful default plus task-based presets that deliberately replace the layout
- Tradeoff
- Replacement is faster and predictable, but its consequence must be stated before selection
Customize dashboard · Arrange
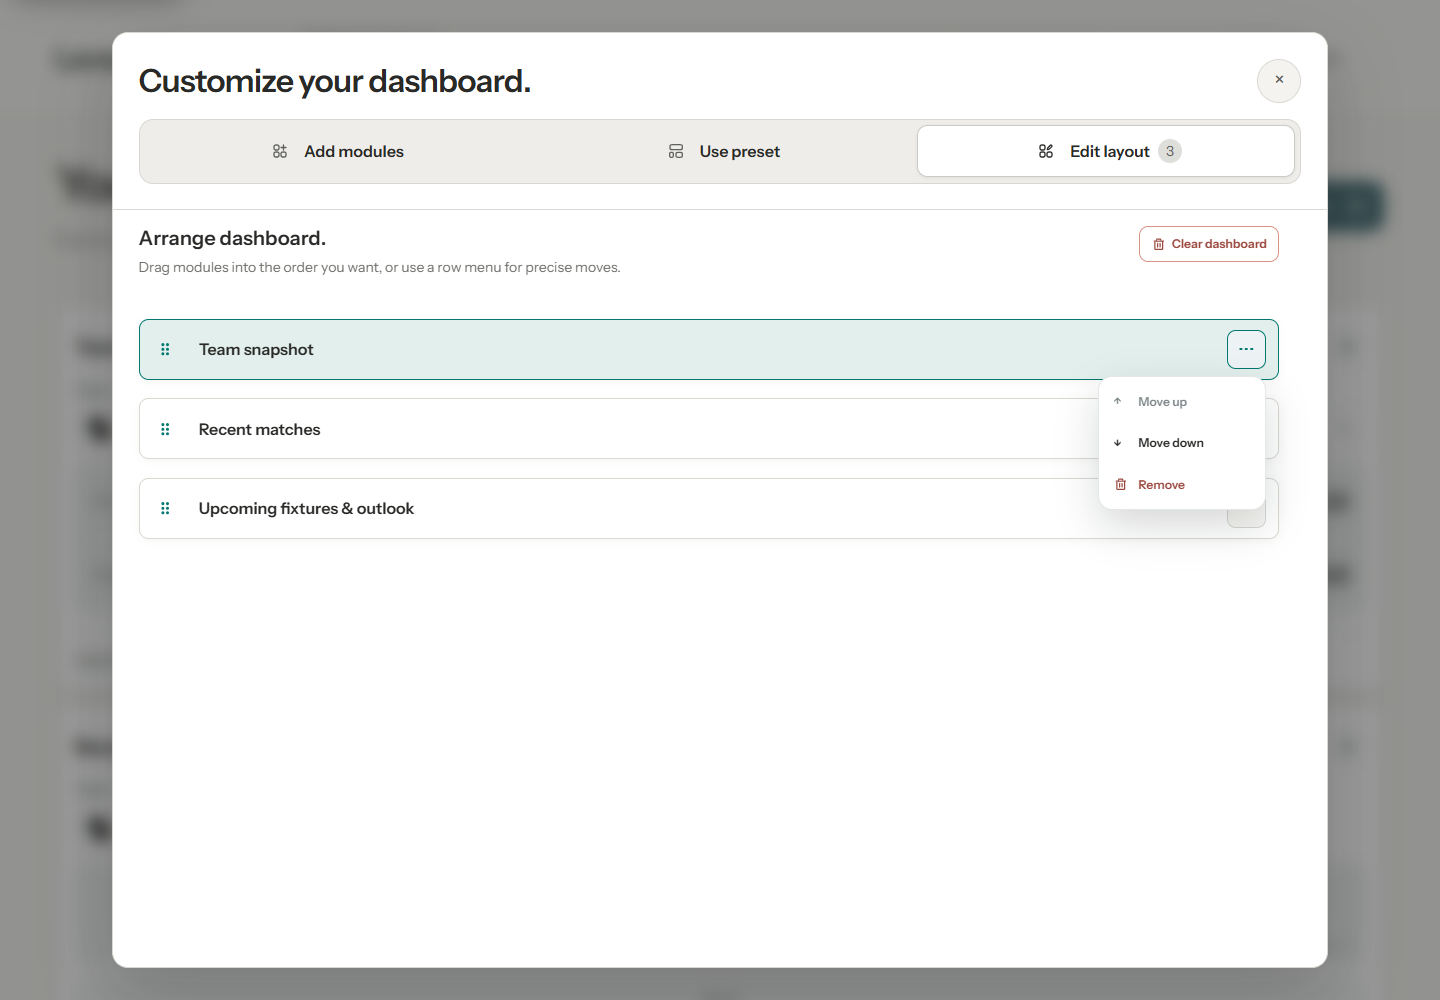
Useful on arrival, adaptable over time
The balanced overview establishes the team, examines recent matches, then looks ahead to fixtures. Visitors can change that order as their question develops.
Drag handles and Move up/Move down actions support reordering. Removal, confirmed clearing, and Undo clear offer recovery; changes are announced for assistive technology. A print-friendly preview keeps the current order and values.
03Learning by doing
The learning space explains the ideas behind the charts, then asks visitors to make an interpretation of their own.
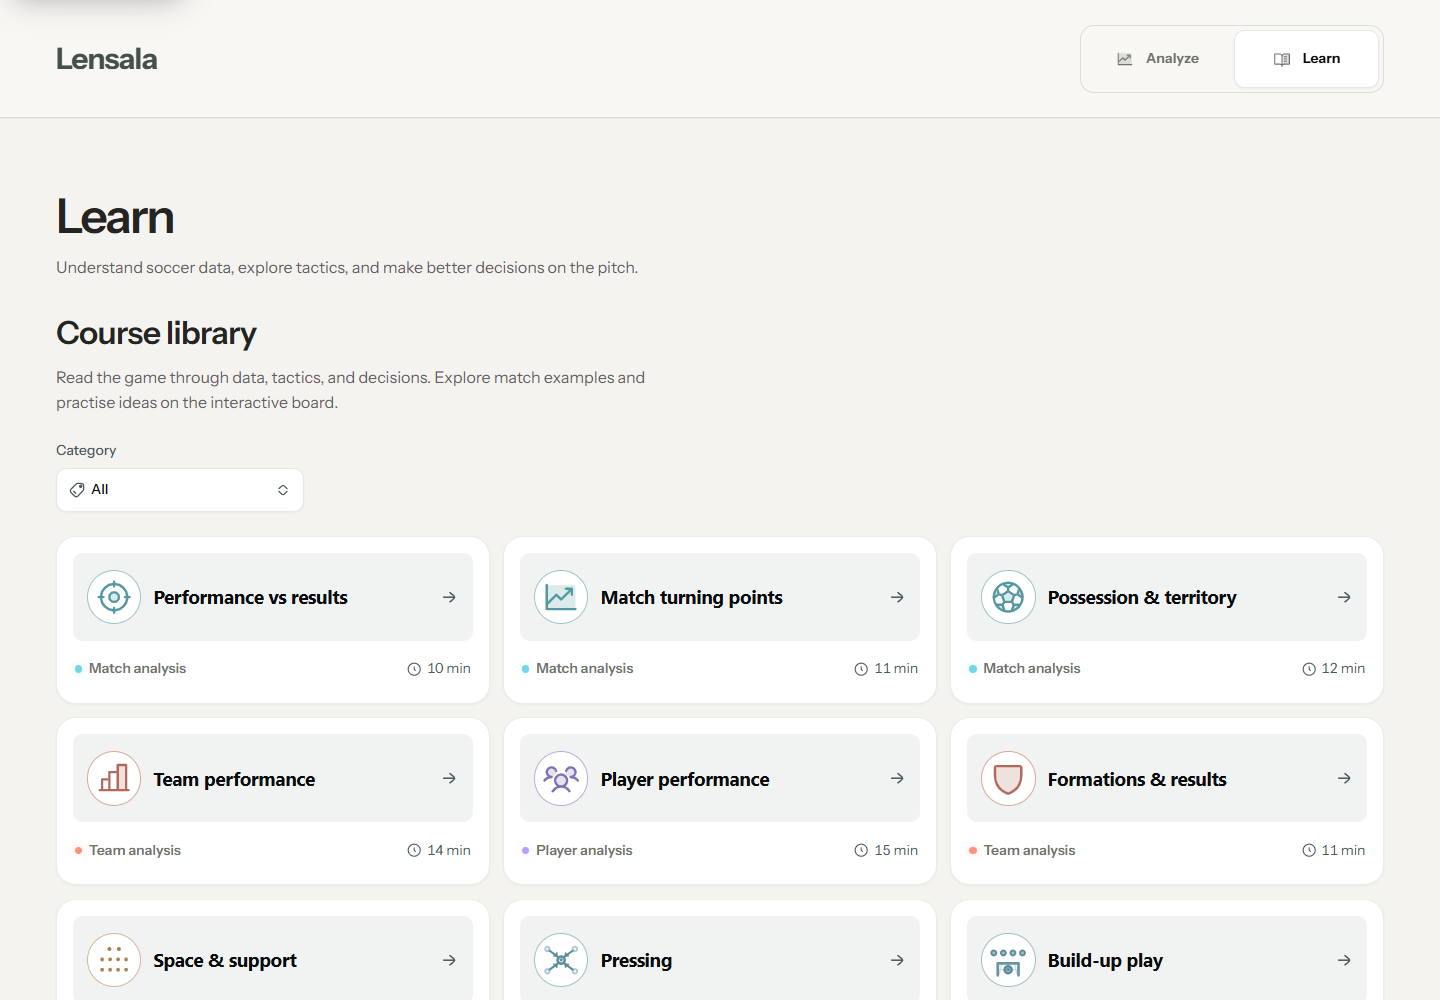
Course library
Start with a question you recognize
Twelve courses use familiar soccer questions to introduce performance, territory, form, and player comparisons. Technique, tactics, and Soccer IQ broaden the library beyond dashboard metrics.
Category filters narrow the choice; duration and a course preview set expectations.
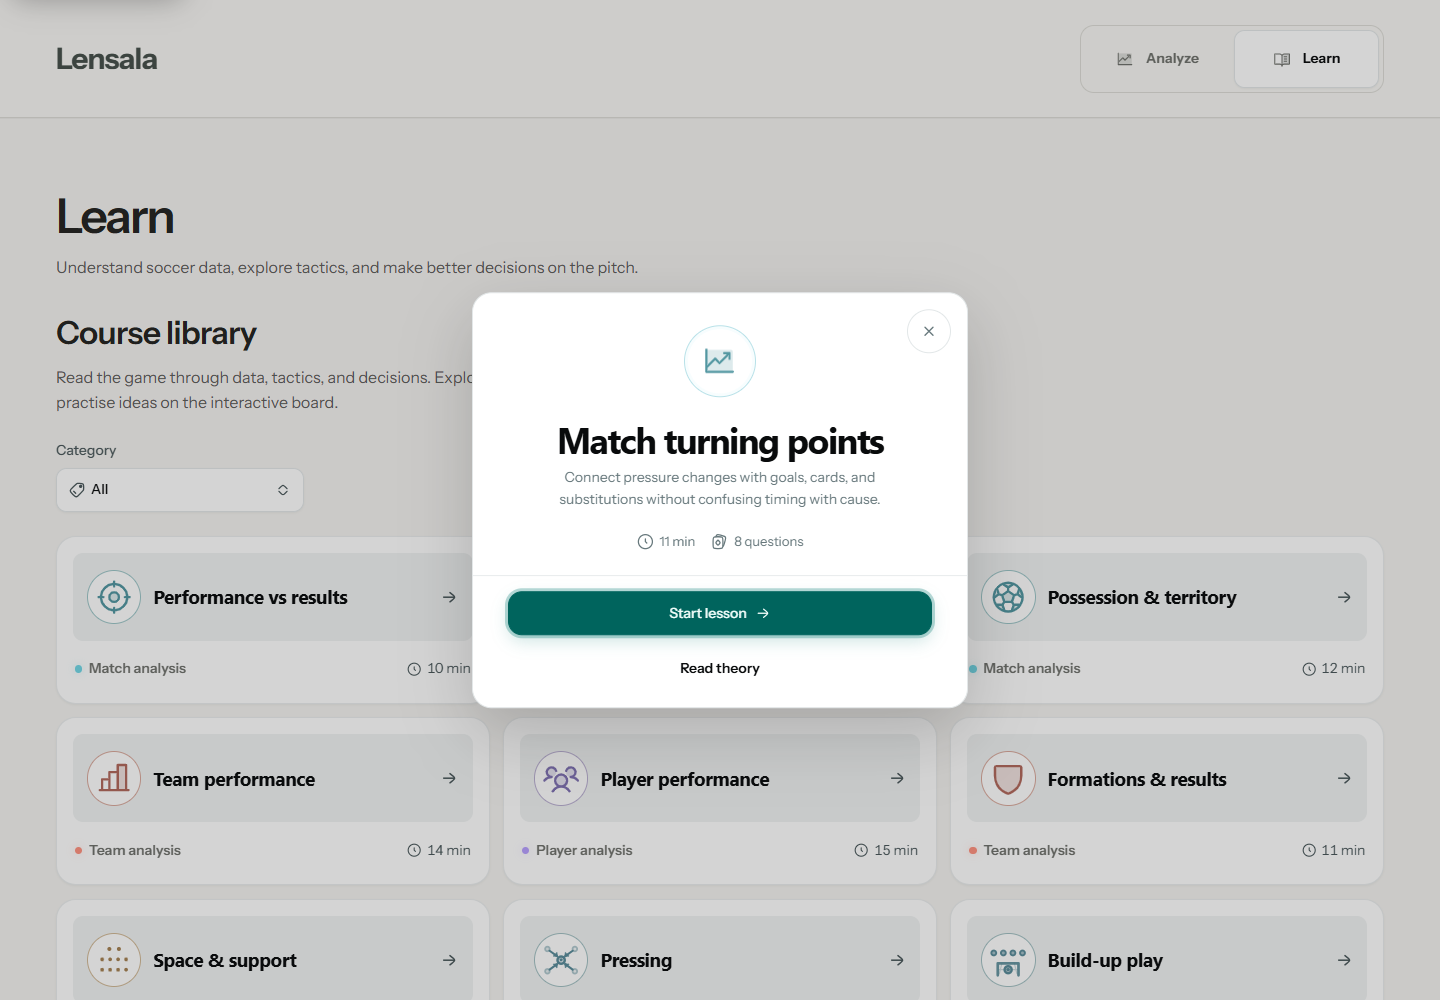
Newcomers can choose Read theory for concept explanations and worked examples before practising. Experienced users can choose Start lesson to test their interpretation immediately, then revisit theory for a refresher. These two entry points make Learn accessible across experience levels, letting visitors choose the support they need.
Browse the course library
Preview the lesson
Build understanding with Read theory
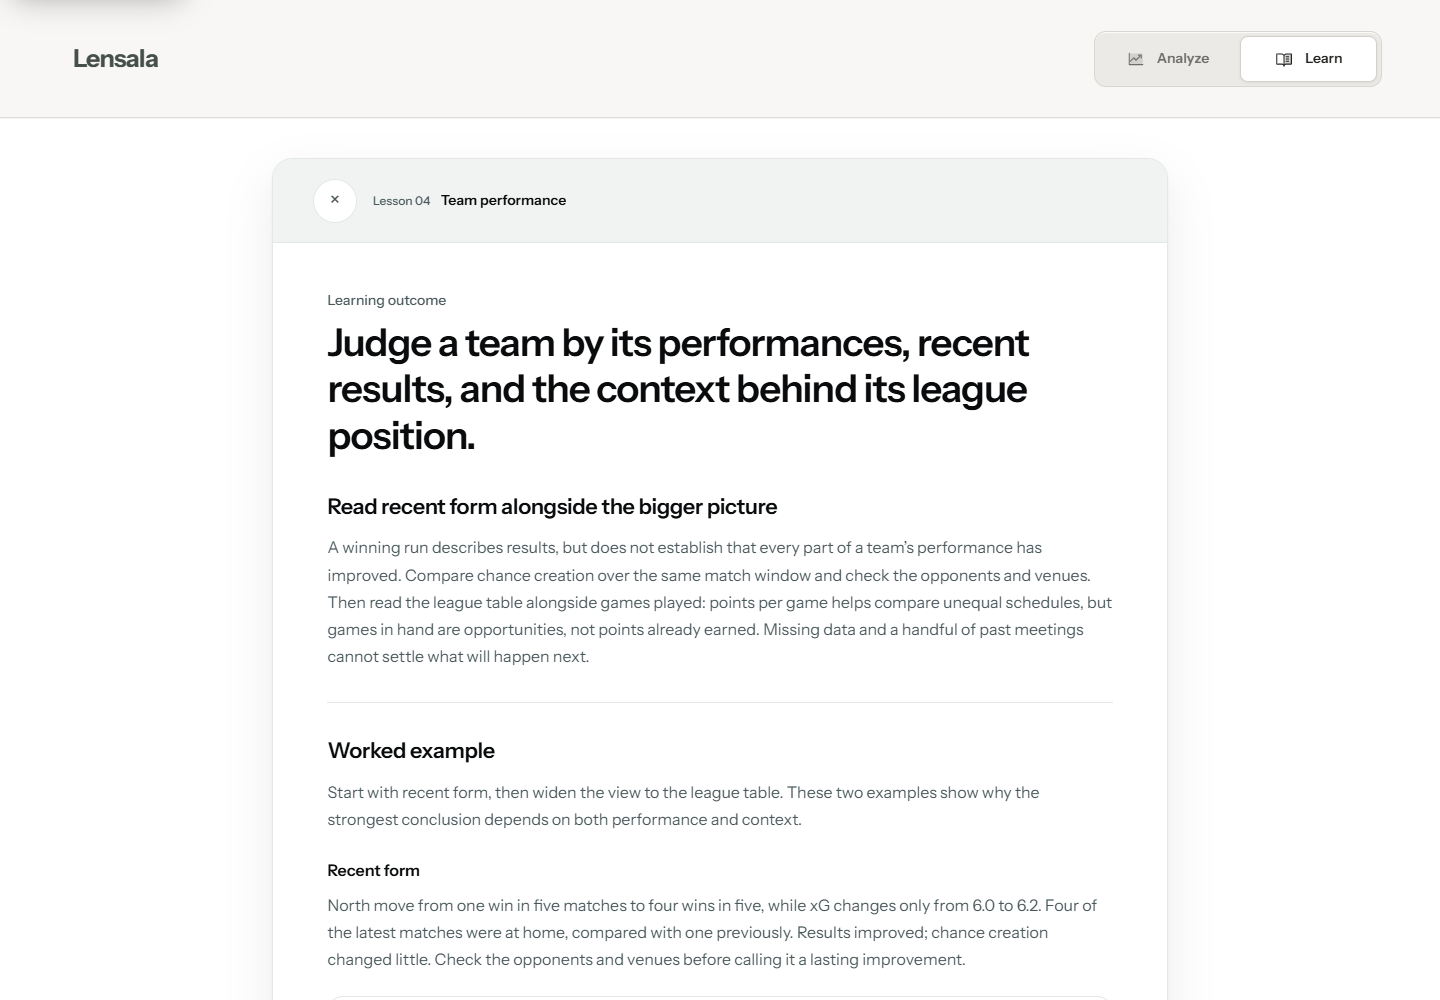
Learning walkthrough · 0:29
Designing Learn
Teach interpretation through interaction
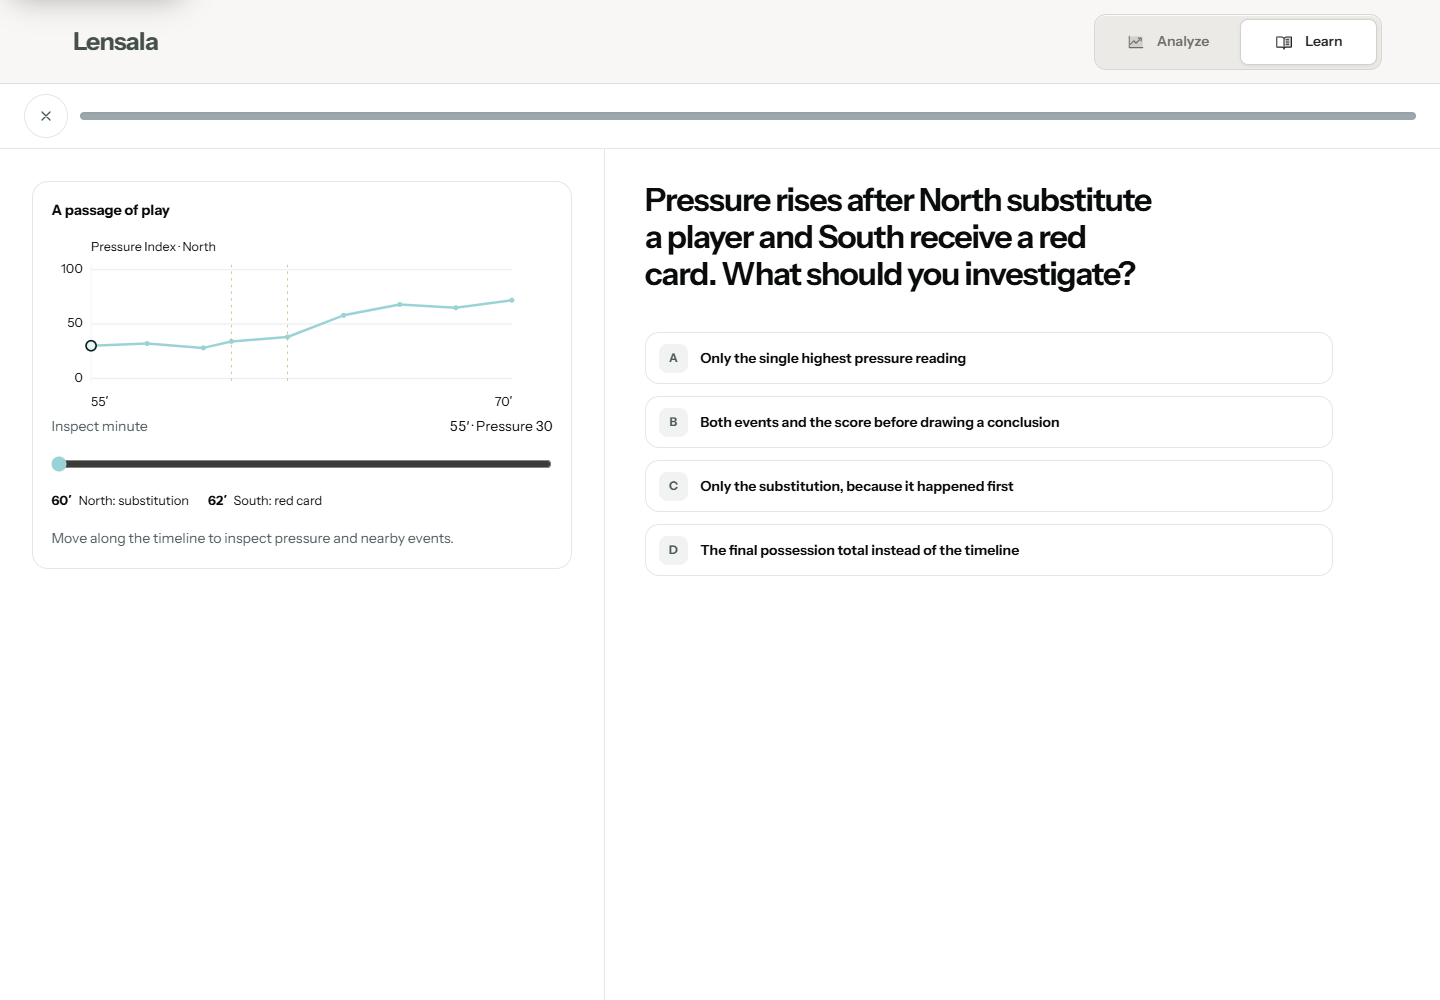
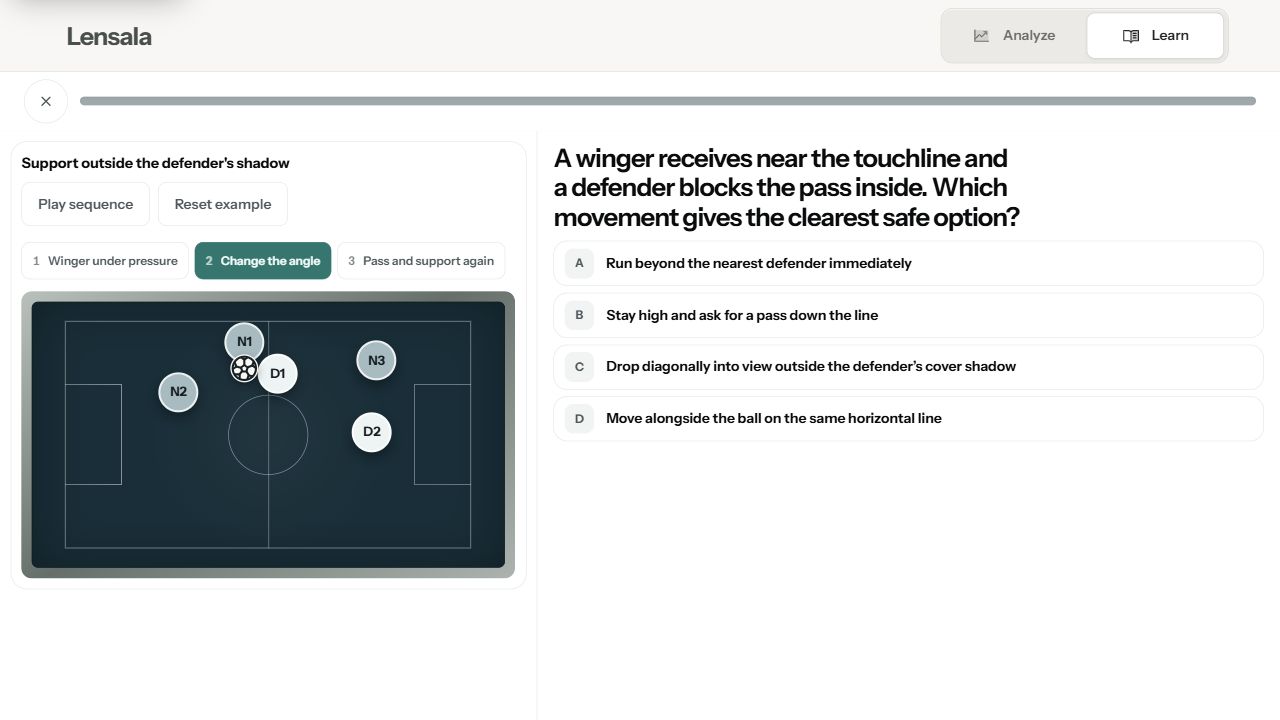
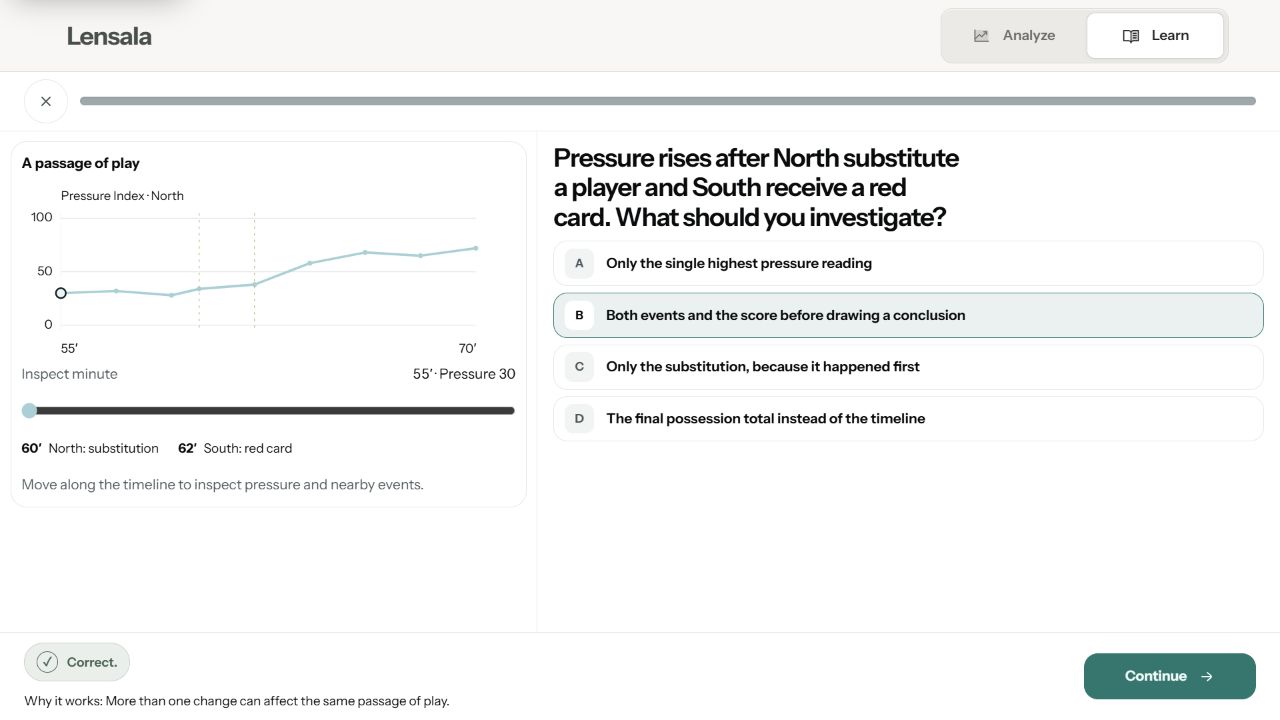
Charts, minute sliders, and tactical boards reuse the visual language of Analyze.
The visual question before feedback
Explore a tactic before choosing an answer
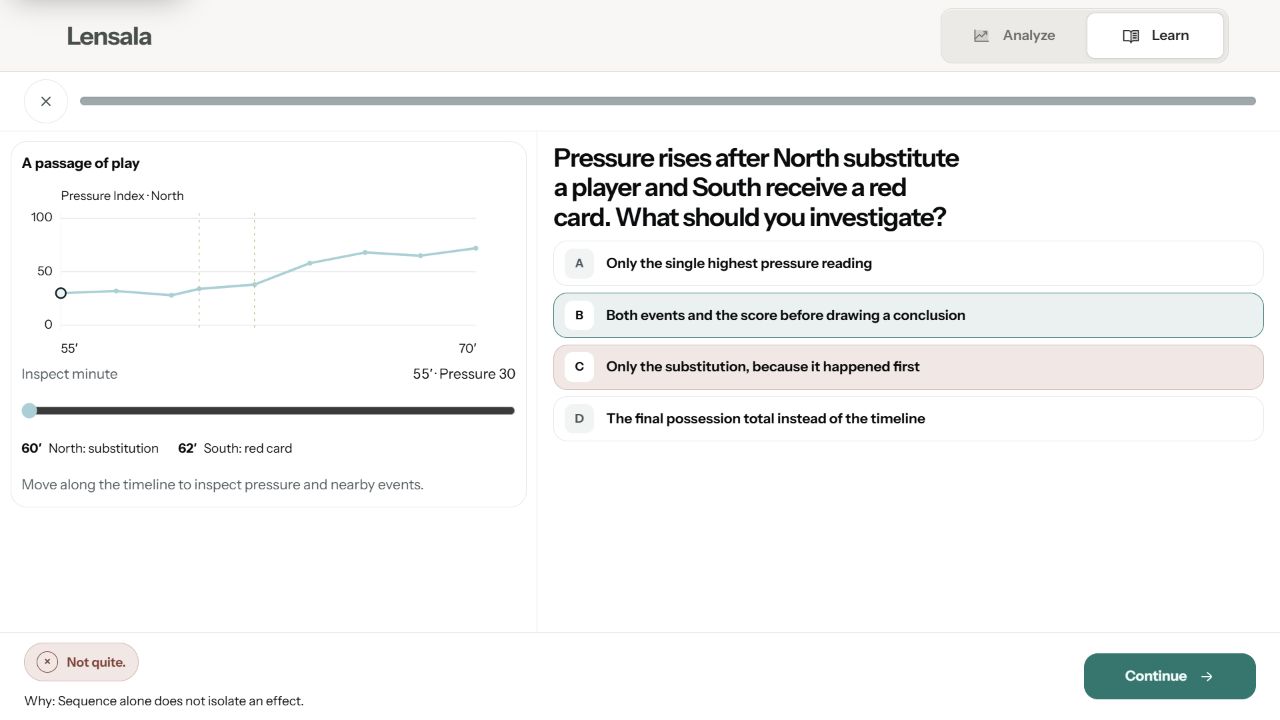
A neutral feedback bar keeps the explanation readable. Color, icons, and text identify the result in a compact badge, while Continue stays consistent across both outcomes.
Explain an incorrect answer
Reinforce a correct answer
04Connecting analysis and learning
Opening a lesson should not mean starting an investigation over.
Analyze → Learn
Preserve the investigation
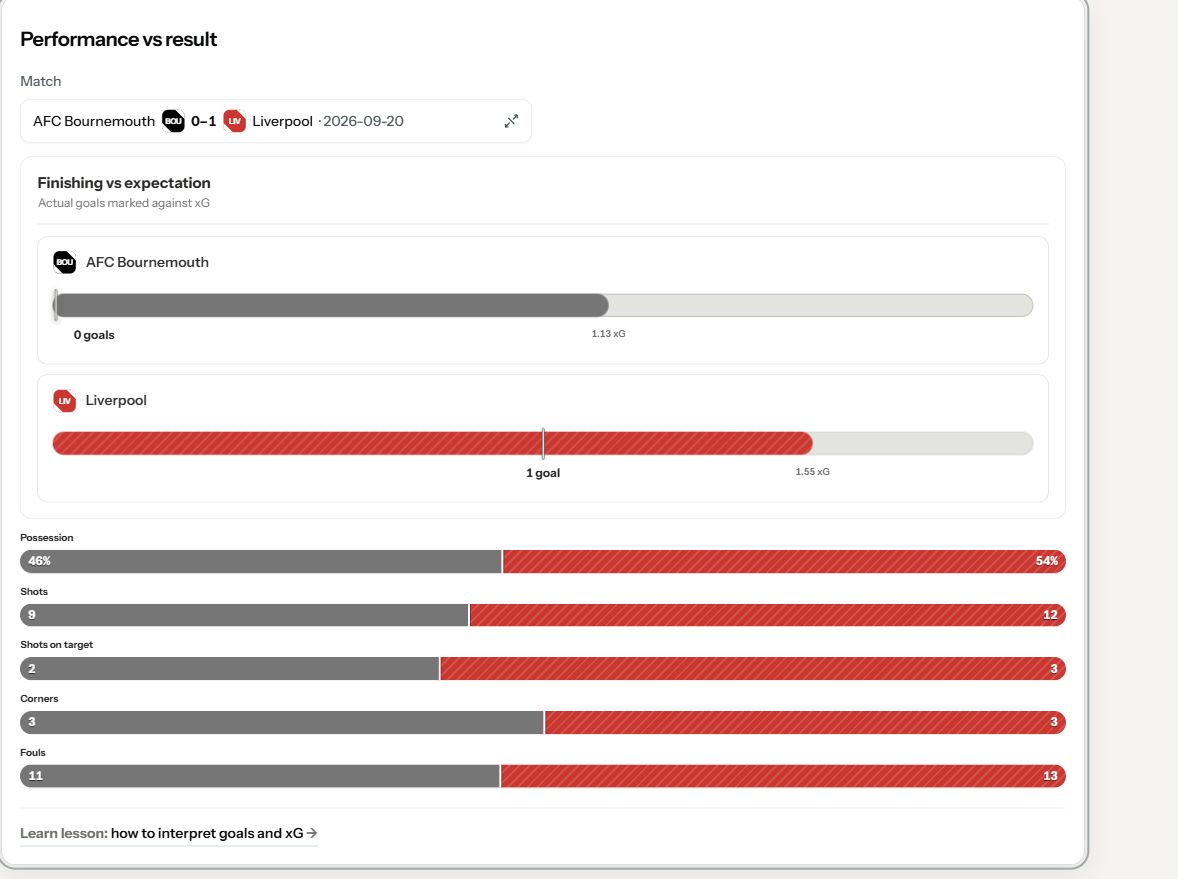
A module opens a relevant lesson with its applicable selections intact. Returning to Analyze reuses the existing module, or adds it if missing, without replacing the visitor’s layout.
Find the relevant lesson
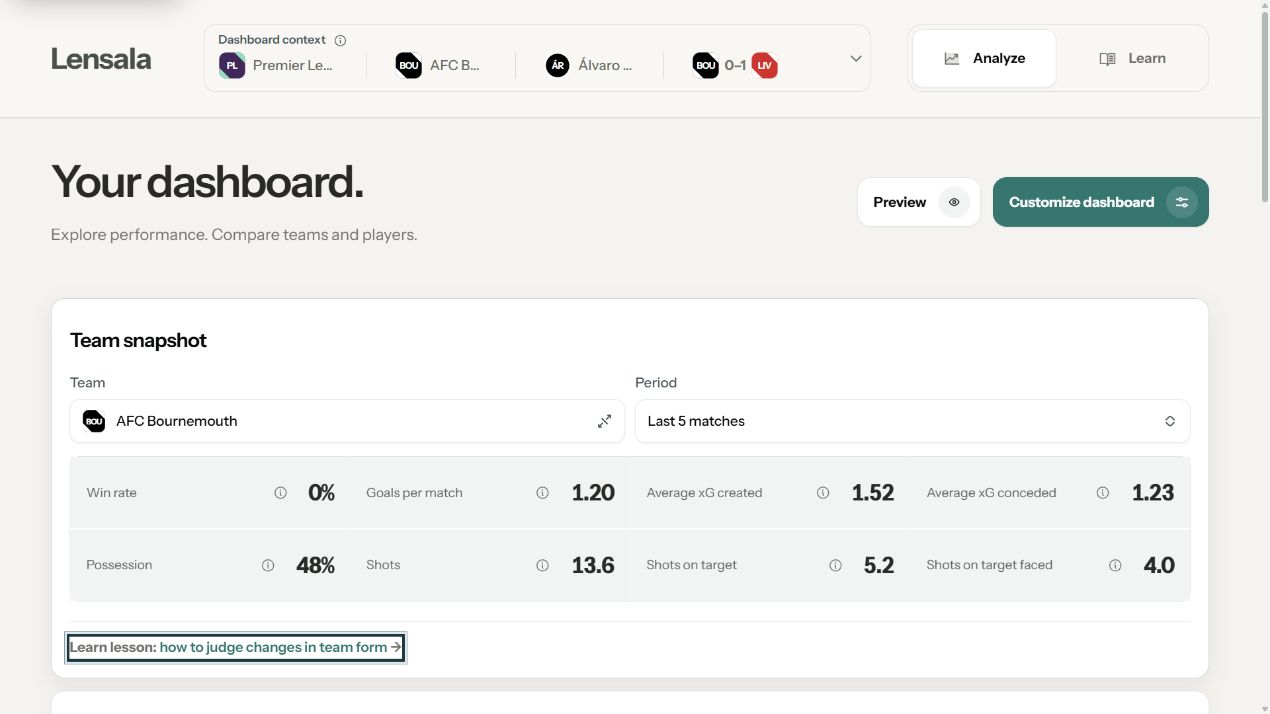
Preview it in context
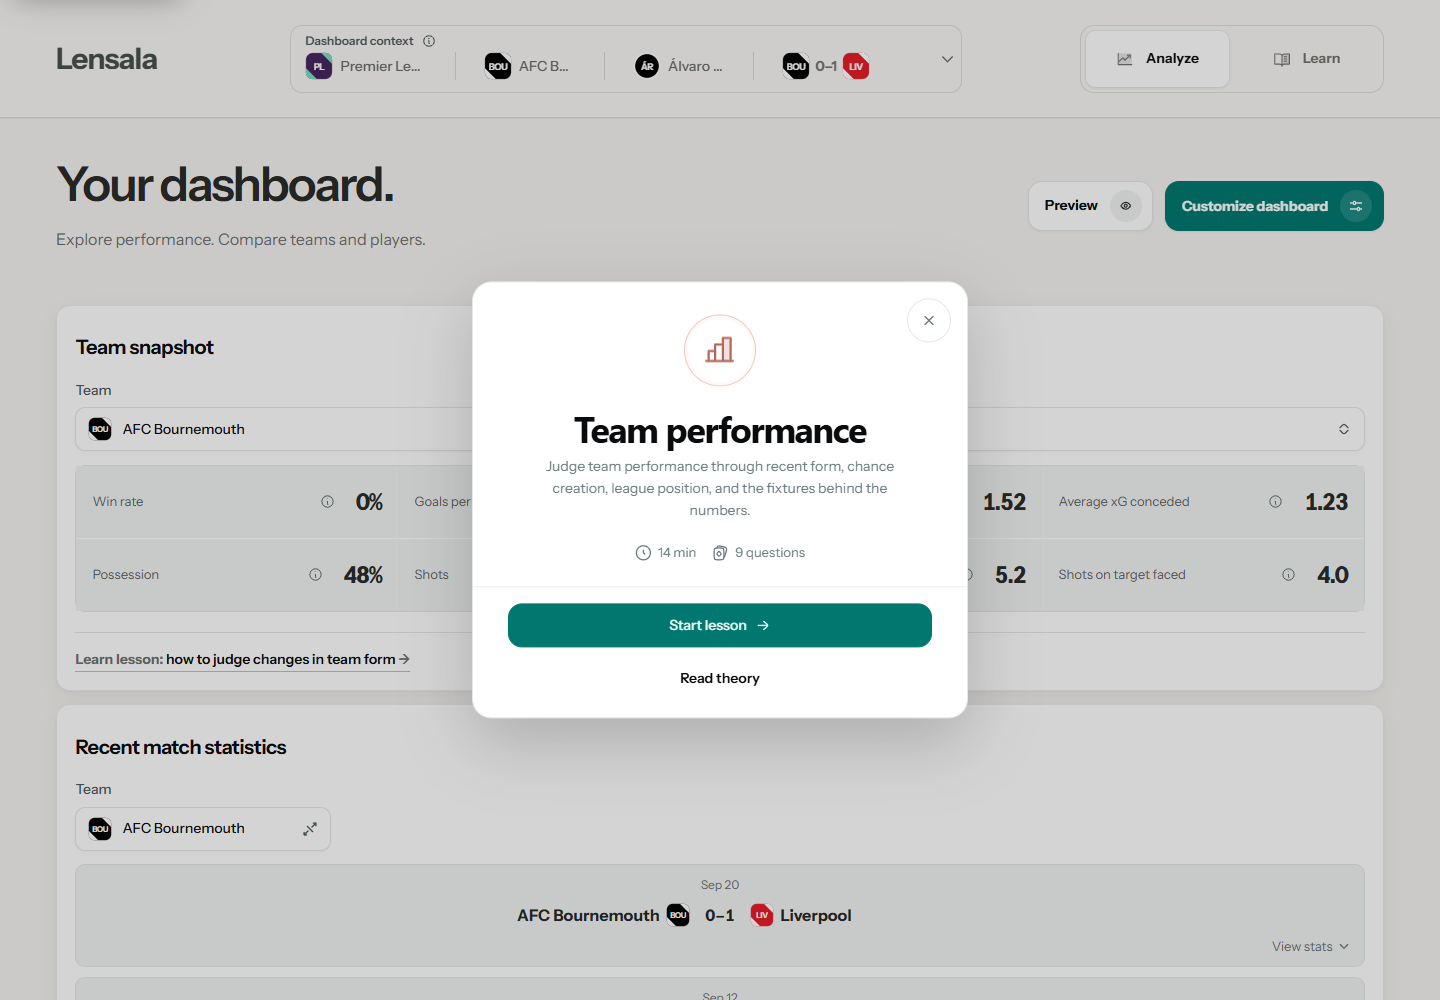
I avoided assigning one course to every module. Specific lessons link directly to charts; broader tactical courses stand alone and inform interpretation across the dashboard.
- Considered
- A one-to-one course for every module
- Chose
- Direct links where the relationship is specific, plus independent tactical courses that influence analysis across the dashboard
- Tradeoff
- Not every course has an in-module entry point, so the library must make broader learning paths easy to discover
Learn → Analyze
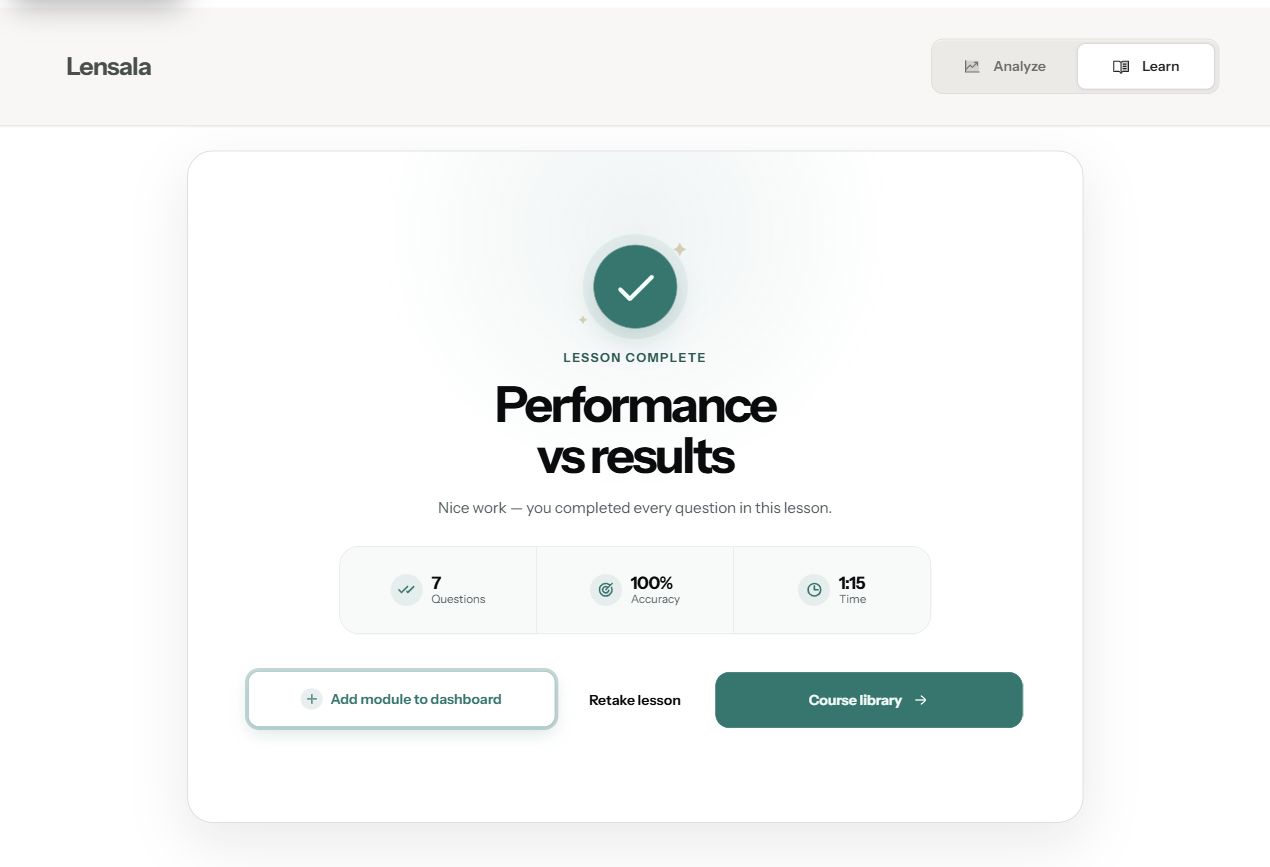
Take learning back into analysis
Course completion offers a direct route to the relevant module. If it is missing, Add module to dashboard inserts it into the existing layout; the action then becomes View module in dashboard. An existing module can be opened immediately.
05Guiding the first visit
The first decision should be about the soccer someone follows, rather than the structure of the software.
From first visit to first useful view
Set the context, then choose a goal
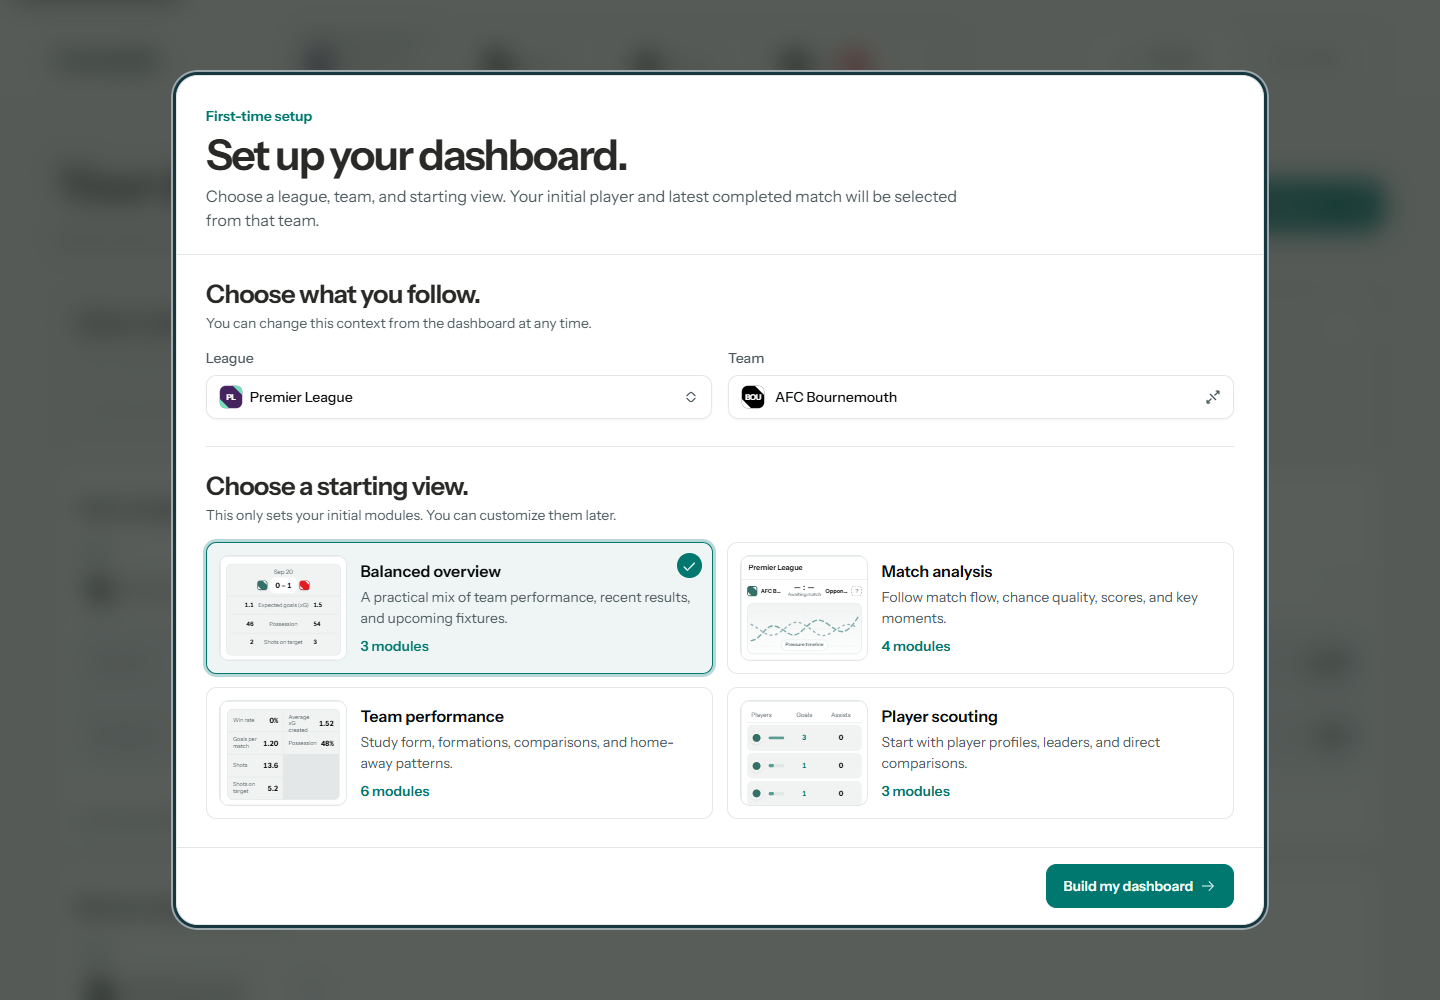
Setup asks for a league, team, and goal: Balanced overview, Match analysis, Team performance, or Player scouting. A preview shows what each starting workspace includes.
Context and modules are seeded together. Where a squad is available, an explained, editable player default removes another setup decision.
How the starting experience evolved. The initial empty dashboard offered flexibility but required visitors to understand the module system before seeing useful evidence. I introduced a populated starting view, task-based presets, and recommendations to reduce setup decisions while keeping customization available as questions develop.
- Considered
- Asking newcomers to select individual metrics and modules first
- Chose
- League, team, and a task-based starting dashboard
- Tradeoff
- Defaults reduce effort, but automatic choices need explanation and an easy way to change them
Teach the controls where they are used
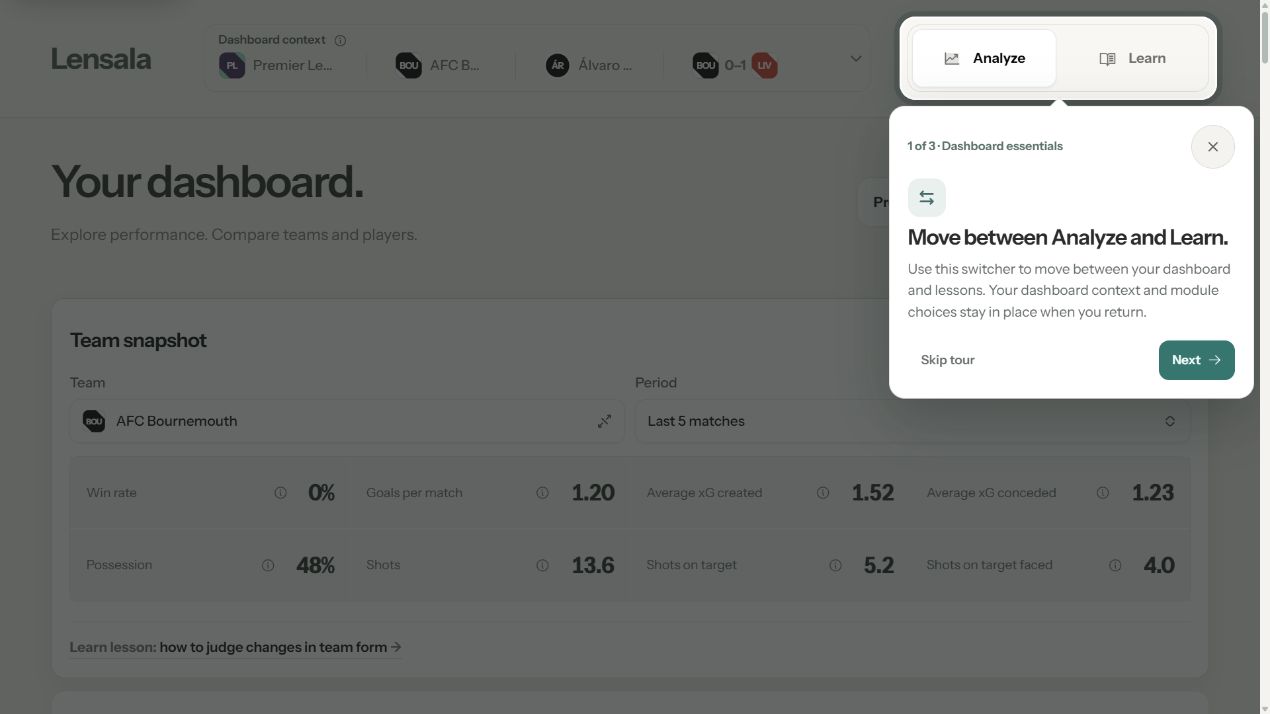
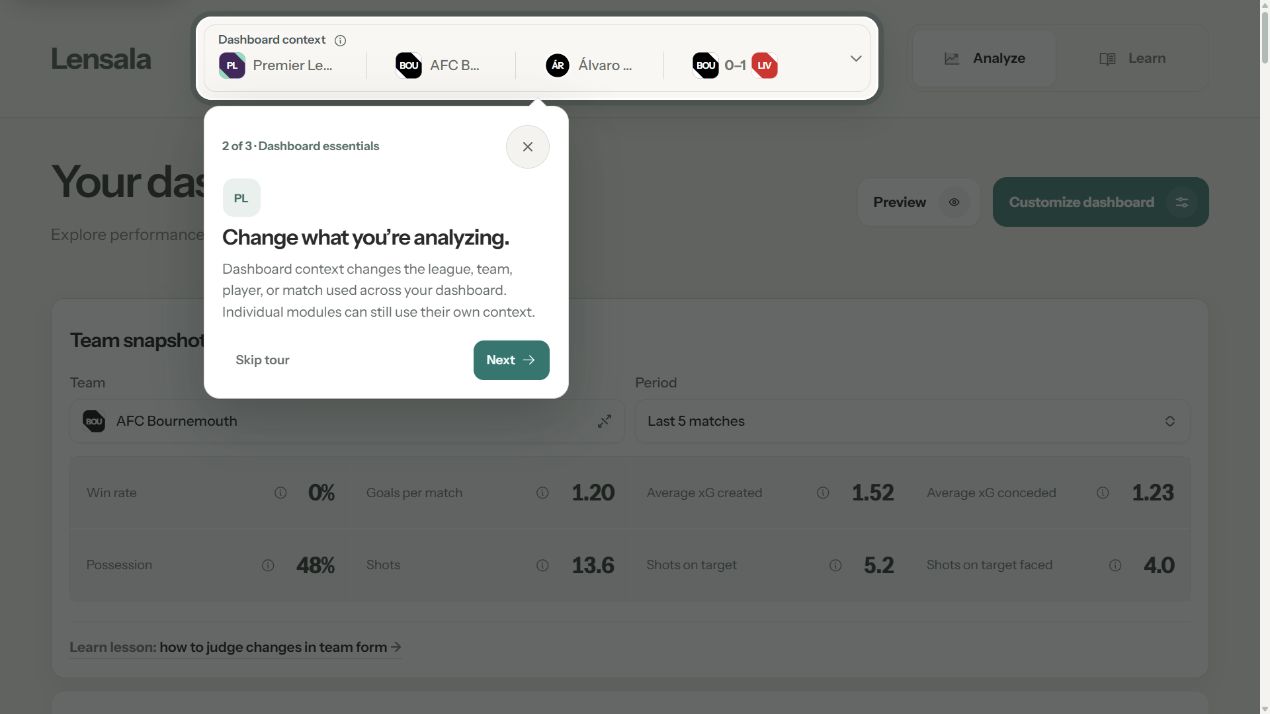
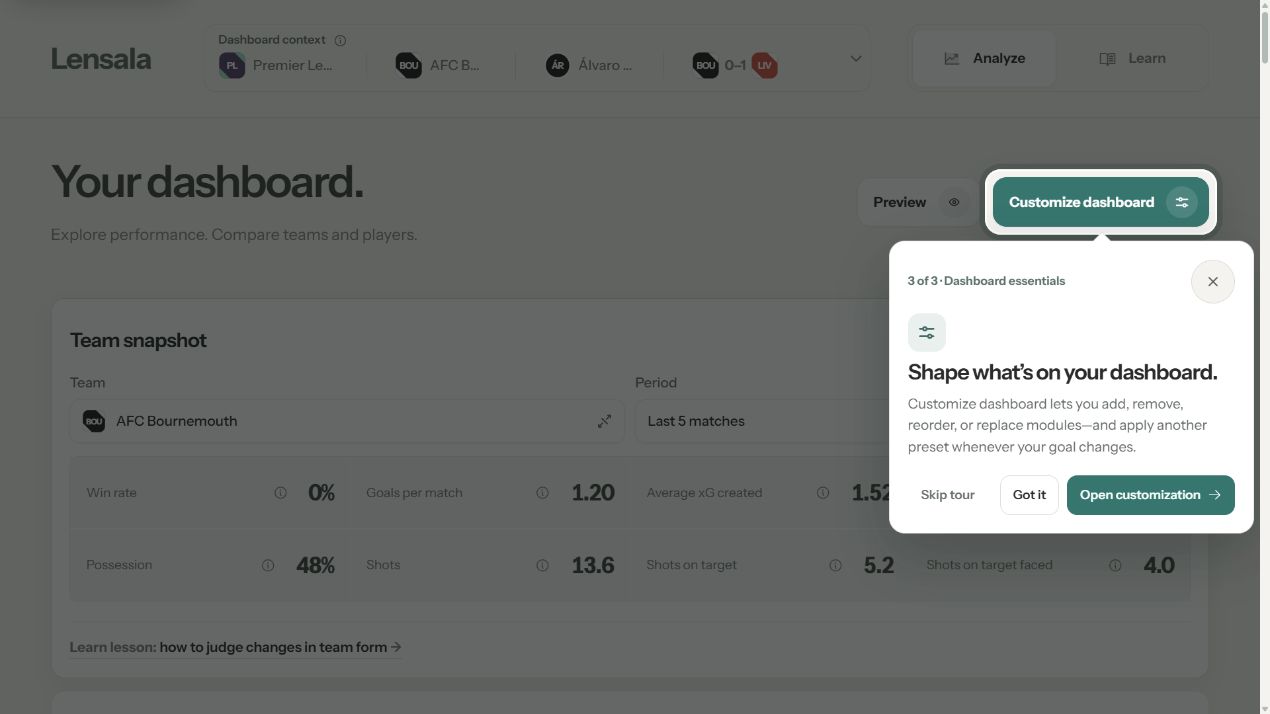
A short coach tour introduces Analyze/Learn, shared context, and customization on the populated screen. The starter guide suggests a reading order through the balanced dashboard.
The coach tour in context
01 · Analyze and Learn
02 · Shared context
03 · Customization
06What I learned
The connections between tools need as much design as the tools themselves.
Designing and building Lensala brought the cost of flexibility into focus: every module, selector, and course added another decision. I learned to give that flexibility a clear structure through task-based starting views, shared context, and visible exceptions. Defining how those parts worked together became a central part of the design.
I also learned to treat explanation and recovery as part of the interaction. Answer-specific feedback, focused review, and a return to the same analysis made the learning loop concrete. In future projects, I would prototype the full journey earlier, including defaults, mistakes, and transitions, so decisions within each view support a coherent experience.
Try the live project